Adaptive Local Extrema Detection in Range Maps
Adaptive Local Extrema Detection
Curvature calculations are clearly of little to no use for selecting "interesting" landmark points. For more on that topic, instead see:
How to calculate
local surface normals
and curvatures
— and why the curvature calculations are so noisy
Human-guided analysis
through landmark selection
We need a method for highlighting that are likely to be more "interesting". Most landmarks in range maps are extrema of some type. They might be local minima (a "pit") or maxima (a "peak"), like signs in cuneiform tablets, or spiny bone structures, respectively. They might be valley or roof edges.
The following method has been developed for automatically highlighting areas of likely interest for further analysis or landmark selection:
[1] Specify some scale of feature size, specific to the object class. This should be roughly equal to the dimensions of the features of interest, and should of course be specified in the units in which the range map was recorded! This is called the radius.
[2] For each point in the range map, march in the four cardinal directions of the range map coordinates (up the column, down the column, left along the row, and right along the row). In each of these directions, find the closest valid point for which the 3-D distance from it to the point of interest is no larger than the radius.
[3] Consider those four points to specify the left, right, top, and bottom limits of a rectangular region of possible interest. (This assumes certain uniformities in the range map which might not be strictly true around surface discontinuities, or jump edges, but the assumption is generally a reasonable one).
[4] Within that rectangular region, find the set of points no further from the point of interest than the radius, and for which both (x,y,z) position and local surface normal are known.
[5] Calculate the centroid and average surface normal for that set.
[6] Calculate the dot product of the average surface normal with the vector from the centroid to the point of interest. This is the height above (or depth below) the local surface patch, where the patch has a radius defined by its actual 3-D size.
[7] Discard those points not at least 5% of the radius above or below the local patch.
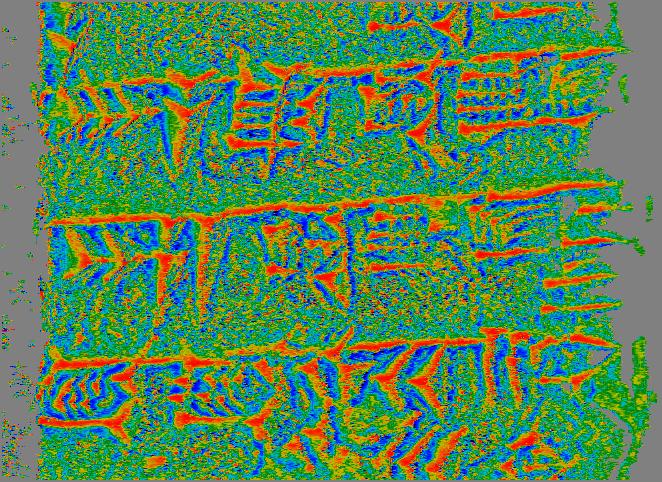
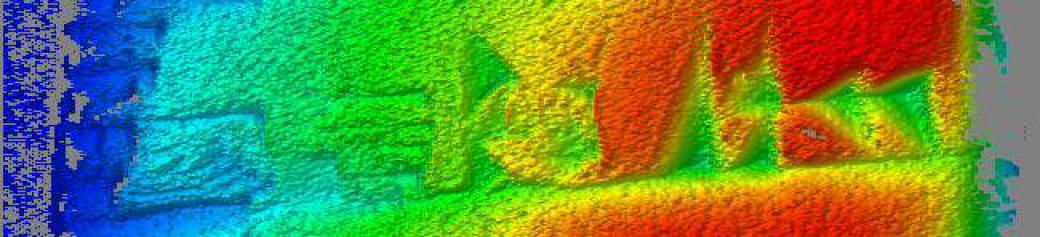
This method provides promising results, and the computational cost is not nearly as bad as was feared (granted, this is being done on a system with a 1.5 GHz CPU clock and 384 MB of RAM).
Below is an example image for a region of a cuneiform tablet approximately 30x30mm in size, using a maximum patch radius of 0.7mm. Here is an archive of similar images for cuneiform tablets