Range Maps for 3-D Data Collection, Analysis, and Applications
Range Maps
A range map is a two-dimensional array of measured 3-D locations. Typical range maps in our work have dimensions of approximately 500x200 measured points, with measurement accuracy of 0.5 mm for the coarser work down to well under 0.1 mm.
Larger objects can be scanned by reconfiguring the sensor. There is a trade-off between the maximum dimension of the specimen and the spatial sampling rates (commonly called "resolution", although that term really is an optical one referring to a completely different concept). Increase the scanning volume and you make the sampling more coarse.
If neighbor relationships within the array of the range map correspond to neighbor relationships in 3-D space (a reasonable assumption for data from a single-plane structured-light sensor), we can calculate local orientation, or surface normal, and then make meaningful images by selecting some suitable mapping of (x,y,z) location and/or orientation to intensity and hue. Each pixel in the image then corresponds to a precisely measured (x,y,z) location.
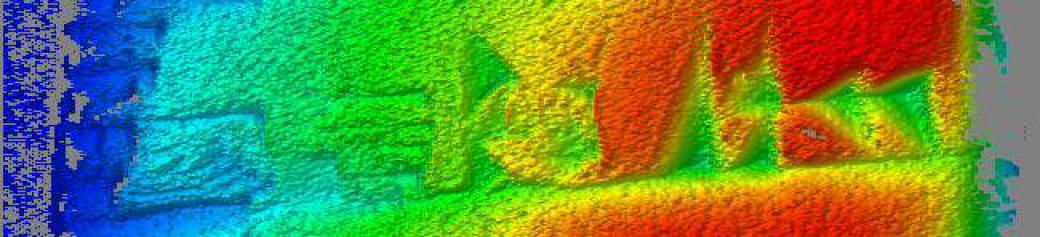
The following images show visualizations of three range maps for a skull of the scorpaenid fish Neomerinthe hemingwayi. The skull is about 90 mm long. The range maps are each about 500x200 points in size, with spatial sampling rates of approximately 0.2-0.4 mm in each dimension (This is relaitvely coarse — note that "contour map" effect on the flat region at the rear of the dorsal view). The intensity of each pixel shows the local surface orientation, using a lighting model that simulates a point light source above the viewer's left shoulder. Hue encodes range from the sensor. Blue points are further away and red points are nearer the sensor.
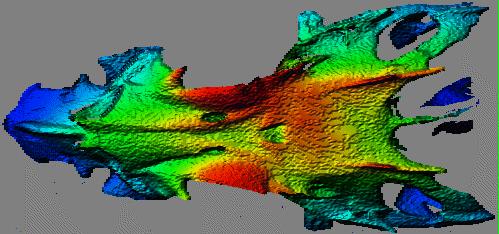
Dorsal view of Neomerinthe hemingwayi skull.
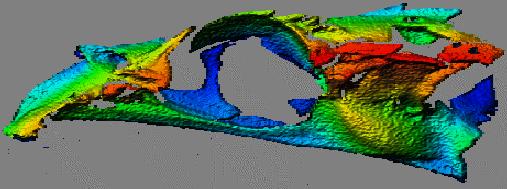
Lateral view of Neomerinthe hemingwayi skull.
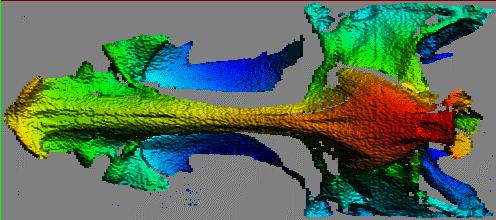
Ventral view of Neomerinthe hemingwayi skull.